






How to Use Fibonacci Extensions for Forex Entry and Exit Planning
 Nov 16,2026
You can identify a promising move in forex but still struggle to decide where to exit. Previous highs and lows give traders somewhere to start, but once price moves past them, finding the next reasonable target becomes harder. A late entry adds another concern, since much of the expected movement might already have happened.
Fibonacci extension levels help you estimate how far price could travel by using the length of an earlier swing. The calculation is fairly simple, although choosing the right swing points takes some judgment, especially while a correction is still developing.
And then comes the practical part of trading. How far is the projected target from the entry, and does that distance make sense given the stop loss? These are worth considering before using an extension level to plan a trade.
Understanding What Fibonacci Extensions Measure
Consider a currency pair that has been falling for several hours. Buyers push it higher for a while, but the recovery runs out of momentum and selling begins again. The first decline is easy to measure. How much lower might the next one reach?
A Fibonacci extension takes the length of that first decline and projects it from the recovery high.
A Fibonacci retracement looks at how much of an earlier move price has given back. With an extension, the measurement is carried forward from the correction to suggest prices the next move might reach.
Most charts offer 61.8%, 100%, 127.2% and 161.8% among the extension levels.
At 100%, the projection repeats the original swing from the end of the correction. At 161.8%, it uses about 1.6 times that distance. The calculation is the same for a buy trade, except that the projected prices appear above the correction.
The percentages are precise. The choice of swing points is less so, and two traders can arrive at quite different targets while looking at the same chart.
Overlapping swings make that choice harder because one trader’s correction may look like another trader’s new trend.
Drawing Fibonacci Extensions on Your Trading Chart
On TradingView, the three-point tool is listed as Trend-Based Fib Extension. In MetaTrader 5 you’ll find it under Fibonacci Expansion.
If you’re learning how to use Fibonacci extension drawings, begin with a completed swing and the correction that follows. For a sell setup, place the points in this order.
- Start with the swing high. Select the price where the original decline began. This becomes point A.
- Mark the swing low. Place point B where that decline ended and price started recovering.
- Find the corrective high. Point C belongs at the high of the recovery, provided there is enough evidence that the correction has finished.
Once C is marked, the platform plots extension prices below it for a possible continuation of the decline.
For a buy trade, start at the swing low, move to the following high and finish at the corrective low. This time the projections appear above C.
Putting the three points on the chart is quick. Deciding that the correction really ended at C can take longer.
Suppose GBP/USD rebounds after a sharp decline and pauses beneath resistance. A trader marks that high as C, but half an hour later another buying wave pushes through it. The original third point needs moving, and every projection moves with it.
A break beneath a minor swing low can offer some evidence that the recovery has run its course. A failed return toward resistance is another clue, although neither tells the trader what the next candle will do.
By the time that evidence appears, part of the next decline might already be over.
The chart period matters too. A recovery that looks substantial on five minutes may barely register on the hourly chart. Choose a swing that fits the time you intend to hold the trade, rather than measuring every small turn on the screen.
Reading Fibonacci Extension Levels With GBP/USD: An example
For a worked example, take a hypothetical sell setup in GBP/USD.
Say the pair falls from 1.3270 to 1.3210, then climbs to 1.3240 before sellers begin returning.
The first fall measures 60 pips.
Place A at 1.3270, B at 1.3210 and C at 1.3240. Those three prices give the following downside projections.
| Extension | GBP/USD price |
|---|---|
| 61.8% | 1.3203 |
| 100% | 1.3180 |
| 127.2% | 1.3164 |
| 161.8% | 1.3143 |
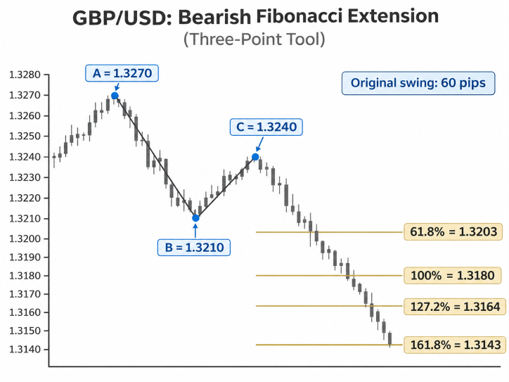
The 100% extension is easy to check. Subtract the original 60 pips from 1.3240 and you get 1.3180.
At 161.8%, the projected fall is about 97 pips, putting the level near 1.3143.
The first extension is the one I’d look at carefully. At 1.3203, it sits only seven pips below the earlier low at 1.3210.
Buyers interrupted the first decline at 1.3210. They might respond there again, so a sell trade targeting 1.3203 depends on price first making it through that old support.
That seven-pip difference can disappear from view when the chart is filled with Fibonacci lines.
There is another reason to pay attention to C. Had the recovery continued to 1.3260, the original swing would still be 60 pips, but the 100% extension would move up to 1.3200.
The first decline hasn’t changed at all. Only the end of the correction has, yet the target is now 20 pips higher.
Using the Extension to Work Out an Entry
The extension drawing gives the trader possible exits, but it says little about when a sell order should be placed.
After the recovery toward 1.3240, imagine GBP/USD fails to make another high and drops through a minor low near 1.3230. Someone trading that break could treat it as a sign that sellers have regained control.
An entry around 1.3230 would still have to satisfy the trader’s confirmation and risk rules.
The corrective high at 1.3240 is the first place to examine for a stop. In this example, a stop at 1.3250 sits 10 pips above it, allowing for a small move beyond the high without keeping the trade open through a much larger recovery.
| Trade detail | Amount |
|---|---|
| Sell entry | 1.3230 |
| Stop loss | 1.3250 |
| Planned risk | 20 pips |
| Previous low | 1.3210 |
| 61.8% extension | 1.3203 |
| 100% extension | 1.3180 |
| Potential gain at 100% | 50 pips |
| Reward to risk at 100% | 2.5:1 |
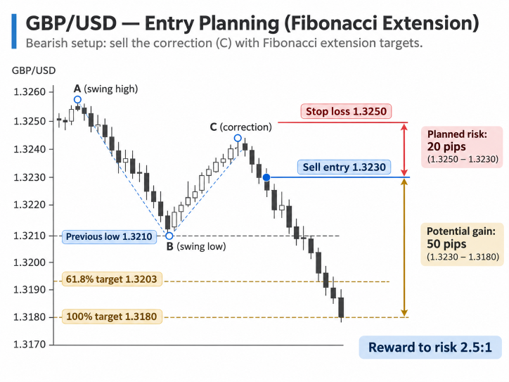
The 100% target at 1.3180 is 50 pips below the entry. With a 20-pip stop, the risk reward ratio is 2.5:1 before trading expenses.
On paper that looks reasonable, but price still has to get past 1.3210, where buyers interrupted the earlier fall.
An entry at 1.3215, after much of the second decline has happened, gives a different calculation.
The original stop is now 35 pips away. Only 12 pips remain to the 61.8% extension at 1.3203, and the 100% projection is another 35 pips below the entry.
Moving the stop closer purely to improve the ratio could put it where an ordinary pullback might reach.
The Fibonacci lines haven’t moved, yet the price available to the trader has changed the decision quite a bit.
Choosing Take-Profit Levels and Managing the Exit
Before setting take profit levels, check what price will meet on its way to the extension. From the GBP/USD sell entry at 1.3230, the old low at 1.3210 comes before the 61.8% level at 1.3203.
Buyers stepped in around 1.3210 once already. The first extension sits only seven pips below it, so expecting an exit at 1.3203 also means expecting that support to give way.
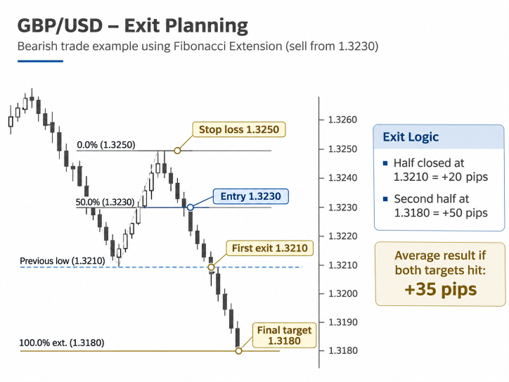
The trader could close the entire position near 1.3210, or take some profit there and leave the rest aimed at 1.3180.
If half the position closes at 1.3210, that half earns 20 pips. The remaining half would earn 50 pips if the 100% extension at 1.3180 is reached.
With both targets reached, the result averages 35 pips across the original position before costs.
If the second half hits the original stop at 1.3250, however, its 20-pip loss cancels the gain from the first half.
Closing part of a trade leaves the remainder exposed, especially when its stop stays at the original price.
An order does not have to sit exactly on the calculated line. GBP/USD could fall to 1.3185 and turn back, leaving a take-profit order at 1.3180 untouched. Placing the order a few pips earlier gives up a little potential gain but avoids relying on an exact touch.
A distant target can also ask too much of a single session. If GBP/USD has moved only modestly on recent days, check that history, or its Average True Range, before expecting another long decline before the close.
Completed charts can be flattering. The highs and lows look obvious afterward, and it’s tempting to notice the extension that almost matches the final price. During the session, C might still be forming or the market might turn a few pips before the order fills.
Keep those near misses and stopped trades in any test of a Fibonacci trading strategy. Leaving them out makes the projection look better than the trades actually were.
Final Thoughts
The arithmetic behind Fibonacci extension levels is straightforward once the swing points are clear. During a live correction, though, the third point can still change, taking the projected prices with it.
An old low might interrupt the move before the target, or a late entry might leave little reward relative to the stop. Either can make a sensible-looking drawing less useful as a trade.
It is easier to see those problems before placing the order than after price starts moving against it.