






Top 3 Forex Trading Strategies for Sideways Markets
 Nov 20,2026

Sideways markets are difficult to trade when price keeps returning to levels it has already tested. A strong bullish candle can look encouraging, but the previous resistance area is still nearby. Entering at that point leaves little room for profit if sellers return, especially when the market has already rejected that price several times.
Traders have to account for the boundaries of the range and the possibility of a breakout that quickly fails. Several forex trading strategies deal with these situations, and we will discuss 3 of them here with their entry methods and practical limitations.
What Does a Sideways Market Look Like in Forex?
A currency pair is moving sideways when it spends an extended period trading within roughly the same price area. There may be rallies and declines during that period, sometimes quite large ones, but neither buyers nor sellers manage to establish a lasting direction.
This condition is also called a range-bound market.
On a chart, you may notice that several rallies have stopped around a similar price while the declines keep finding buyers near another level. These areas form the upper and lower boundaries of the range.
Two candles stopping at the same high do not establish one, and a currency pair that has been drifting lower for days may simply be correcting before its decline continues. A recognizable range usually has several meaningful reactions around its boundaries.
Top 3 Forex Trading Strategies for a Sideways Market
1. Range Trading With Support and Resistance
A range trading strategy starts with identifying the price areas where the market has repeatedly turned. Traders look for buying opportunities near the lower boundary and selling opportunities near the upper one, expecting price to move back through part of the range.
You can draw two horizontal zones across the recent swing highs and lows. There is little reason to trade immediately if the pair is somewhere in the middle, where the distance to either boundary may offer poor value.
Suppose USD/CAD has spent several sessions moving between 1.3720 and 1.3800. These are hypothetical prices. After another decline toward 1.3720, buyers return and a candle closes back inside the range near 1.3730. That recovery could offer a possible buy entry, with the stop below the support area and a target somewhere toward the upper half of the range.
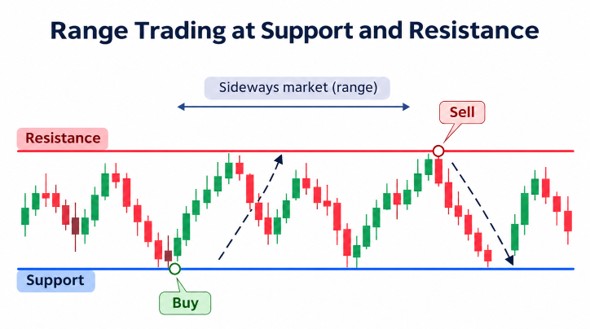
Traders sometimes place a buy order directly at support because it has held several times before, only to discover that the next visit is the one that breaks through it. Waiting for buyers to show some activity may improve the entry decision, even if it means paying a slightly higher price.
One difficulty with support and resistance trading is deciding how far to place the stop. Too close to the boundary and ordinary price fluctuations may trigger it. Too far away and the trade may no longer offer enough potential profit for the amount at risk.
The range itself eventually ends as well. If price starts closing well beyond the established boundary and holds there, continuing to trade toward the old range can become expensive.
2. Bollinger Bands Strategy
Some sideways markets have uneven boundaries. Price keeps swinging up and down, but the turning points are not close enough to draw particularly useful horizontal lines.
Bollinger Bands can help traders study these movements.
The indicator places three lines around the price. The middle is usually a 20-period moving average, while the upper and lower bands are commonly set two standard deviations away. The bands spread apart when price movements become more variable and draw closer when volatility decreases.
A Bollinger Bands strategy for sideways markets looks at how price behaves around the outer bands.
When the market is fairly flat, a move toward the lower band can attract traders looking for a recovery. Near the upper band, they may watch for selling. This approach is associated with mean reversion, the tendency for price to move back toward an average after travelling away from it.
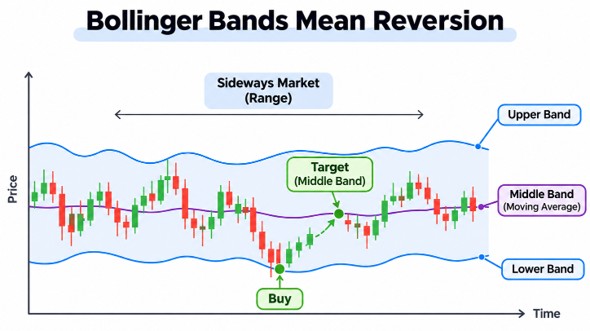
During a developing trend, price may keep moving along the upper or lower band for several candles. A trader selling every upper-band touch could end up taking repeated losses.
A move toward the lower band followed by price closing back inside the bands may be more interesting than a candle that is still falling sharply. The RSI indicator can provide additional information about momentum, particularly when it begins recovering after a decline.
The middle Bollinger Band is one possible profit-taking area. A trader expecting a larger recovery might look toward the opposite band, although price does not have to travel that far.
Band width also deserves attention. When the lines become unusually close together, volatility has contracted. A substantial move may follow, so traders should be cautious about assuming the market will continue bouncing between the bands.
3. False Breakout Trading Strategy
A false breakout occurs when price moves beyond an established level and then returns inside the earlier trading area.
Consider a pair that has repeatedly struggled near resistance. During another rally, price finally moves above the old highs. Instead of attracting sustained buying, the move fades and the following candles bring price back below resistance.
Traders may interpret that return as a sign that the breakout has failed. Some wait for a candle to close inside the range before considering an entry, while others watch for another attempt to reclaim the broken level.
The trade would generally follow the move back into the range. After a failed upside breakout, that means looking for a possible sell.
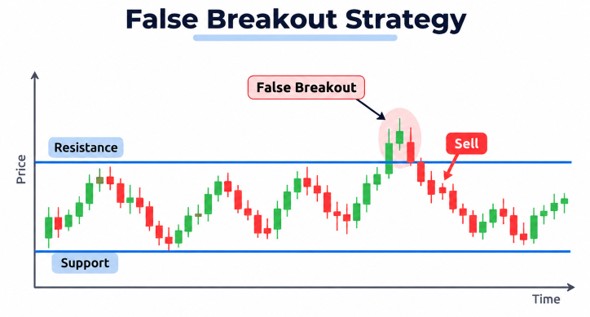
A stop can be considered beyond the highest point of the failed breakout, where a renewed rally would weaken the selling idea. Profit targets might sit around the middle of the range or toward its lower boundary, depending on how much room remains.
Failed downside breakouts can provide the opposite setup.
This strategy requires more caution around major economic news. A quick move outside the range might be the beginning of a lasting trend, even when the first candle looks exaggerated. Spreads may widen during these periods too, affecting the entry and the eventual loss.
Which Strategy Works Best for Different Conditions?
| Market behaviour | Strategy to consider |
|---|---|
| Price repeatedly turns near recognizable support and resistance areas | Range trading |
| Price moves around a relatively flat moving average, with uneven but recurring swings | Bollinger Bands |
| Price briefly breaks outside a well-established range and then returns | False breakout trading |
Managing Risk During Sideways Trading
Before placing a range trade, work out the stop loss and take profit levels using the actual chart. An entry near support may seem attractive, but the trade needs enough room for ordinary fluctuations without exposing too much of the account.
Trading costs deserve attention as well. A 15-pip range may leave very little potential profit after spreads, especially when the entry comes several pips away from support.
It is also worth reviewing the economic calendar. Central bank decisions, inflation figures and employment reports can change expectations quickly enough to end a range that had remained intact for days.
Final Thoughts
Sideways conditions do not prevent traders from finding opportunities, although they change the kinds of setups worth considering. A market that repeatedly returns to familiar prices may suit range trading, while Bollinger Bands can help assess less orderly swings. Failed breakouts offer another possibility once an established level has been tested and rejected.
The usefulness of these forex trading strategies depends heavily on recognizing when the conditions that supported them have changed. A trading range can last several sessions or finish during the next announcement, so entries and risk limits need to reflect the market as it is behaving.