





How to Create a Day Trading Plan Using Price Action: Step by Step Guide
 Nov 12,2026

A price reaches yesterday’s high and hesitates. The next candle moves above it, only to slip back a few minutes later. Looking at the finished chart, the movement might seem easy to understand. Watching it happen is different, particularly when you have to decide if the break is worth trading or if the market is about to reverse.
That uncertainty is familiar to people learning day trading. A chart can show you where prices have reacted before, but it cannot decide when you should enter or how much money you can afford to put at risk. Those decisions belong in a day trading plan, worked out before the session becomes busy.
A price action trading plan begins with information already on the chart. Previous highs and lows, areas where price repeatedly turned, and the way candles close around those areas can help you judge what is happening. The same approach can be studied on currencies, stocks, futures and cryptocurrencies, although their trading hours and contract sizes need to be considered separately.
Step 1. Decide What You Will Watch During the Session
You do not need to follow several markets to learn price action. Begin with an instrument whose trading hours you can regularly observe, and decide how long you intend to be at the screen. Someone with an hour available after the US stock market opens will plan differently from someone who trades around the London session or follows crypto in the evening.
Choose a higher timeframe for context and a lower one for possible entries. The one-hour and five-minute charts are one combination, but a 15-minute chart paired with a shorter entry chart can also work. The important part is understanding why you are using each. A decline on a five-minute chart might only be a pullback within a much larger rise, something that is easier to recognise when the broader movement is visible.
Check the day’s calendar before marking a trade. Earnings announcements can sharply affect individual shares, while economic releases can move currencies, index futures and other markets. If the instrument tends to become erratic around a scheduled event, decide beforehand if you want to stay out during that period. This prevents a routine setup from turning into an unplanned attempt to trade the news.
Step 2. Read the Price Movement Before Looking for an Entry
When you open a chart, first look at the movement across several candles rather than trying to interpret the latest one. Three broad patterns help explain what you are seeing:
- Uptrend: Significant highs and lows keep moving higher.
- Downtrend: Significant highs and lows keep moving lower.
- Range: Price keeps returning towards similar upper and lower boundaries.
In an upward trend, a temporary fall does not necessarily mean the direction has changed. The type of movement matters when choosing a setup. Buying every apparent breakout in a range, for instance, can lead to a string of disappointing entries when price keeps returning inside it.
You may also notice long wicks or strong candle closes near an earlier turning point. A wick shows that price reached an area and moved away before the candle ended, while the closing price tells you where the market finished that interval. Neither is reliable on its own. A rejection candle becomes more useful when it appears at an area you had already identified and agrees with the broader movement.
Step 3. Mark the Areas Where You Would Consider Trading
Once the market’s recent direction is reasonably clear, look for prices where something changed. A previous day’s high or low, the edge of a trading range or an area that produced several visible reactions can be a useful reference. Support describes an area where earlier selling was met by buying, while resistance describes one where earlier advances struggled to continue.
Try marking only the two or three areas that seem relevant to the current session. If the chart contains a line across every small candle high, it becomes difficult to tell which areas matter. Price also seldom turns at precisely the same number twice, so a narrow zone is often more practical than treating one price as an immovable boundary.
Suppose a market has been rising, pulls back several times towards an area around 100 and recovers. That area may be worth watching on the next pullback. Its history gives you a reason to pay attention, although the next test could break through it. We have identified a possible location for a trade, not an instruction to buy.
Step 4. Decide What Must Happen Before You Enter
For a first price action trading strategy, it helps to practise one setup rather than combining several unfamiliar patterns. We will use a pullback towards support during an upward trend. The same principles can later be examined for selling near resistance during a downward trend.
Imagine the price returns to the area around 100. Instead of buying the first touch, you wait for a candle to dip into the zone and finish back above it. In our hypothetical example, the market trades at 99.80 before closing at 100.20. That close suggests buyers were able to push it back above the area during the candle, giving you a condition that can be checked on earlier charts.
There is still a limit to what you should pay. If the next available entry has already jumped far above 100.20, the stop would be further away and the remaining room to the target could be smaller. Write down the situations in which you will leave the setup alone:
- The candle closes below support without the expected recovery.
- Price turns away before reaching the area you marked.
- The entry comes too late to justify the distance to the stop.
A break and retest of resistance could form the basis of a different price action trading strategy, but it would need its own rules and testing rather than being added halfway through a session.
Step 5. Work Out the Risk and Exit Before Placing an Order
An entry only becomes a workable trade when you know where the idea would be proved wrong. For the example above, suppose a possible buy is available at 100.20, with the stop at 99.50, beyond the support area. The distance to the stop is 0.70 in quoted price units. If earlier price movement shows resistance near 101.60, the possible gain is 1.40 units, giving a reward-to-risk ratio of 2:1 before expenses.
| Part of the example | Quoted price |
|---|---|
| Proposed buy entry | 100.20 |
| Stop loss | 99.50 |
| Possible profit target | 101.60 |
| Distance to stop | 0.70 |
| Distance to target | 1.40 |
| Reward-to-risk ratio | 2:1 |
These numbers illustrate how the calculation works on a chart, rather than a live trade in any particular market. A move of 0.70 does not represent the same cash loss across all instruments. With a share quoted in dollars, one share would lose $0.70 on that movement. A currency pair has pip values, while a futures contract has a specified tick value and multiplier. Crypto positions also vary according to the quantity bought and any leverage used.
Suppose the account contains $1,000 and the planned maximum risk on one trade is 1%, or $10. The position size should be small enough that the distance to the stop, multiplied by the cash value of each price movement, stays within that amount after allowing for costs. If the broker’s smallest trade would exceed the allowance, the sensible choice is to skip it rather than move the stop closer simply to make the numbers fit.
Decide on a daily loss limit and when open trades must be closed as well. A day trading plan should describe what happens before the session ends, including the possibility of closing a position that has reached neither the stop nor the target. Stops can also fill at worse prices during fast markets, so the calculated loss is an estimate, not a guarantee.
Step 6. Put the Rules on One Page and See If They Hold Up
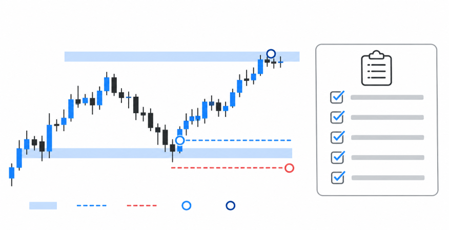
Illustrative price action and a written trade checklist, without reference to one market
By now the day trading plan can be short. Much of the thinking has already been done while choosing the session, studying the movement and deciding what would count as an entry. A simple trading plan example might look like this.
| Question to settle | Rule to write in your own plan |
|---|---|
| When will I trade? | Name the instrument, session and timeframes |
| What market condition am I looking for? | A clear trend or range, identified from recent highs and lows |
| Where will I pay attention? | Two or three marked support or resistance areas |
| What qualifies as an entry? | A defined candle close or price reaction at the marked area |
| When will I skip the trade? | Missing confirmation, price already too far away, or insufficient potential reward |
| Where will I exit? | Stop beyond the point that invalidates the setup, with a target based on a nearby price area |
| How much can I lose? | Maximum risk per trade and daily loss limit, calculated using the instrument’s contract value |
| When is the trade finished? | At the planned exit or by the stated end-of-session time |
The trading plan example can look convincing after one successful trade, but a single entry tells you very little about how reliable the rules are. Open earlier charts and move through them candle by candle, marking levels with only the information that would have been available at the time. Record every occasion that meets the entry conditions, including the trades that would have lost money and the days when nothing qualified.
The notes can be fairly simple. For each qualifying setup, record:
- The market condition and price level identified beforehand.
- Why the entry qualified, or why the trade was skipped.
- The planned entry, stop, target and eventual result, including costs.
Check whether losses tend to occur in ranges, around announcements or after late entries. Over a larger sample, these observations can help you judge if a rule needs changing or the setup is being used in the wrong conditions.
A demo account is useful for practising the same decisions while prices are moving live, although it cannot reproduce every aspect of trading real money. When you eventually consider a live account, your day trading plan and position-size calculation should already be familiar enough that you are not inventing them while an order is open.
Final Thoughts
Price action can give you a sensible reason to watch an area of the chart, but the trade still depends on what happens when price gets there. Sometimes the confirmation appears, sometimes the level fails, and quite often the market moves away without providing a suitable entry. A useful price action trading plan accounts for all three outcomes, leaving you with a record of decisions you can examine rather than a collection of trades whose reasons are difficult to remember.