





5 Best MT5 Indicators for Forex Trading and How to Use Them
 Nov 05,2026

MetaTrader 5 comes with 38 built-in technical indicators that help forex traders examine market trends, measure momentum and assess volatility. These tools convert recent price movements into lines, bands or numerical readings, making certain changes easier to observe on a chart.
So, which MT5 indicators provide useful trading signals, and what do their readings actually mean? Here are 5 commonly used indicators, explained through their calculations and practical applications.
1. Moving Average (MA) for Identifying Market Trends
A moving average takes a series of recent prices and calculates their average, producing a line that follows the general direction of the market. The calculation is repeated as every new candle forms, allowing traders to see the underlying trend without focusing on every minor fluctuation.
The number selected determines how many candles are considered. For example, a 20-period moving average on an hourly gold chart follows the average price over 20 hourly candles. On a daily chart, the same setting represents 20 daily candles. A Simple Moving Average (SMA) gives every period equal weight, while an Exponential Moving Average (EMA) gives greater importance to recent prices and generally reacts faster.
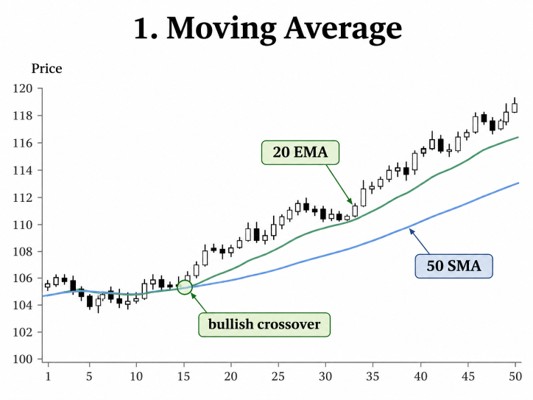
Suppose Gold remains above a rising 50-period moving average. This can suggest that buyers have maintained control over the recent trend. Traders may also compare a faster 20-period EMA with a slower 50-period average. When the faster line crosses above the slower one, the crossover can indicate improving short-term momentum.
In MT5, choose Insert, Indicators, Trend and Moving Average, then select the period and calculation method. Moving averages can be useful for following trends, although their signals tend to arrive later because they are calculated from prices that have already occurred.

2. Relative Strength Index (RSI) for Measuring Momentum
The Relative Strength Index (RSI) compares the strength of recent upward price changes with downward changes. It then converts that relationship into a reading between 0 and 100. As buying movements become stronger relative to selling movements, RSI generally rises, while sustained selling pressure causes it to decline.
The usual setting is 14 periods, meaning the calculation is based on recent price changes over 14 candles, using Wilder’s smoothing method. On an hourly chart, these are hourly candles. In MT5, the RSI indicator appears below the price chart, with 70 and 30 commonly used as reference levels.
An RSI reading of 75 means recent gains have been relatively strong. Traders describe this as overbought, although it does not mean the price must immediately fall. Similarly, a reading below 30 indicates strong recent downward momentum and is commonly called oversold. In a strong trend, the indicator can remain near either extreme for some time.
Traders also watch for divergence. If a pair reaches a higher price high but RSI forms a lower high, the rise may be losing momentum. That observation can draw attention to a possible correction, particularly when price behaviour begins confirming the change.
3. MACD for Examining Momentum Changes
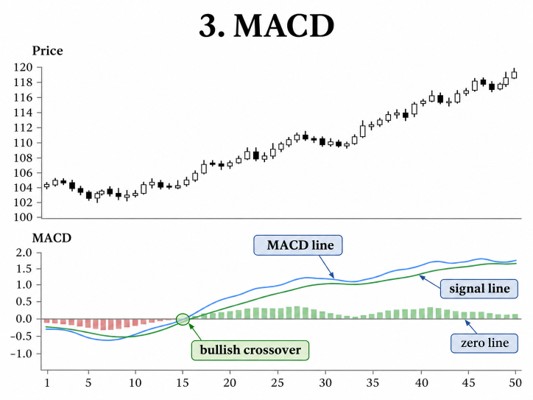
Moving Average Convergence Divergence (MACD) compares two exponential moving averages to show how momentum is changing. Its standard calculation subtracts the 26-period EMA from the faster 12-period EMA. The resulting value is called MACD, and a nine-period average of that value forms the signal line.
A positive MACD value means the faster EMA is above the slower one, while a negative value means it is below. Traders therefore look at the zero level to understand the relationship between short-term and longer-term price movement.
The signal line helps identify changes within that relationship. When MACD moves above its signal line, upward momentum may be improving. When it falls below, momentum may be weakening. For instance, a bullish crossover below zero might indicate that a decline is easing, even though the broader trend has not yet turned upward.
On MT5’s standard MACD display, the main MACD values appear as histogram bars and the signal line appears as a curve. Traders compare the bars with that line and with the zero level. Repeated crossings during sideways trading can be less informative because the market has little sustained direction.
4. Bollinger Bands for Analyzing Price Volatility
Bollinger Bands place 3 lines directly around the price candles. The middle line is usually a 20-period simple moving average, while the upper and lower bands are calculated two standard deviations away from it. Standard deviation measures how widely prices are spread around their average.
When prices fluctuate within a narrow range, that spread becomes smaller and the bands move closer together. When the price changes become larger, the bands generally widen. Traders can therefore observe how active or inactive the market has been simply by looking at the space between the lines.
For instance, Gold could spend several hours moving within a tight range while the bands contract. This formation is commonly called a Bollinger Band squeeze. If the price subsequently breaks out and the bands begin widening, it can indicate that volatility is increasing. The squeeze alone, however, does not indicate whether the eventual movement will be upward or downward.
Traders also examine whether candles remain close to an outer band. A series of candles near the upper band can reflect sustained buying strength, while repeated movement near the lower band can accompany a decline. Touching a band is therefore not, by itself, a reliable instruction to close or reverse a trade.
5. Average True Range (ATR) for Setting Stop Loss and Profit Targets
The Average True Range (ATR) tells traders how much an instrument has been moving, on average, during recent candles. It measures the size of price movements without indicating their direction. Unlike RSI, which uses a scale from 0 to 100, ATR is expressed in the same price units as the instrument being analyzed.
To understand its calculation, consider a one-hour gold candle with a high of $3,920 and a low of $3,895. Its high-to-low range is $25 per ounce. ATR also checks the candle’s distance from the previous closing price so that any price gap is included. It calculates an average of these true ranges, commonly over 14 periods.
Suppose ATR(14) on gold’s hourly chart reads 28.00. This means the average true range of recent hourly candles is approximately $28 per ounce. It does not mean the price will rise $28 in the next hour, and it does not predict the next candle’s direction.
A trader buying gold at $3,900 could use that reading to assess possible stop-loss and target distances. A stop just $5 below the entry may be small compared with recent hourly movement, whereas a profit target $42 higher represents one and a half times the ATR reading. These are reference distances, not automatic trading instructions. The final stop must also suit the chart structure and the amount the trader is prepared to risk.
In MT5, ATR appears in a separate window below the chart. A rising ATR line indicates larger recent movements, while a falling line indicates that the market’s fluctuations have become smaller.
Final Thoughts
Among these 5 MT5 indicators, moving averages help identify direction, RSI and MACD examine momentum, and Bollinger Bands and ATR describe volatility. Their readings become easier to interpret once traders understand what prices go into each calculation.
The best indicators for forex trading ultimately depend on the information needed for a particular decision. Understanding what a signal represents can be considerably more useful than adding several indicators without knowing how their readings are produced.