Financial trading has evolved significantly over the years, with technology revolutionizing how traders analyze markets and make decisions.
Among the myriad tools available, technical analysis stands out as a key approach for traders across the globe. For cTrader users, mastering the usage of technical tools can help them shape more informed and precise trading strategies.
In this article, let’s explore how participants can utilize cTrader’s technical analysis objects to elevate their trading experience.
What is Technical Analysis?
At its simplest, technical analysis is the study of price movements and patterns to predict future price actions. It assumes that historical price behavior will repeat itself due to collective market psychology, supply, and demand. Technical analysts capitalize on visual tools like charts and market statistics to find trends, reversals or continuations.
Unlike fundamental analysis, which evaluates an asset’s intrinsic value, technical analysis is purely about price action. It can be applied to any asset class, forex, cryptocurrencies and commodities. By finding patterns and trends, technical analysis will give you a roadmap to anticipate market movements and trade opportunities.
For example, when trading forex pairs, technical analysis can help them find support and resistance levels, trend lines or volatility zones. The beauty of this approach is that is universal – you can be trading Bitcoin or GBPUSD, but the principles remain the same.
Getting Started with cTrader’s Technical Analysis Tools
cTrader is one of the best trading platforms with plenty of technical analysis tools. Accommodating both new and professional traders, cTrader integrates intuitive features to make the analysis smooth.
Here is how to use its technical indicators and charting tools.
Technical Indicators on cTrader
cTrader has a wide range of technical indicators from simple moving averages to complex ones like Bollinger Bands and Ichimoku Kinko Hyo. Indicators work like trading assistants, graphically representing market data to help you find patterns, support and resistance levels and potential breakout points.
Adding an indicator to your chart on cTrader is easy. You can click the Indicators icon in the top-row control panel, or right click on the chart and select the Indicators section from the appeared menu. Once added, indicators will update on the charts in real time, so you can see the market conditions.
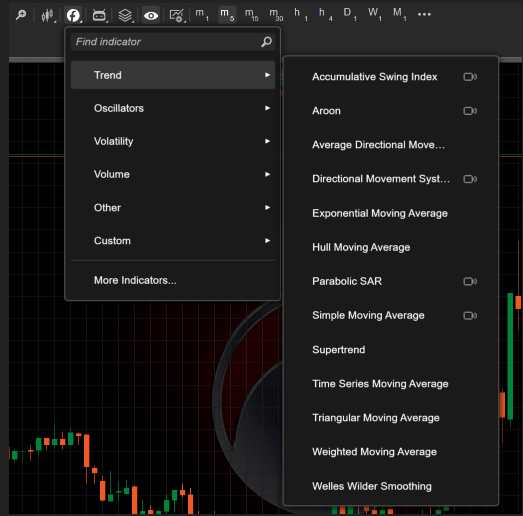
For example, if you want to measure market volatility, Bollinger Bands will help you visualize the expansion and contraction of price movements. Or if you want to see changes in market momentum and potential reversals, the Moving Average Convergence Divergence (MACD) indicator is perfect for that.
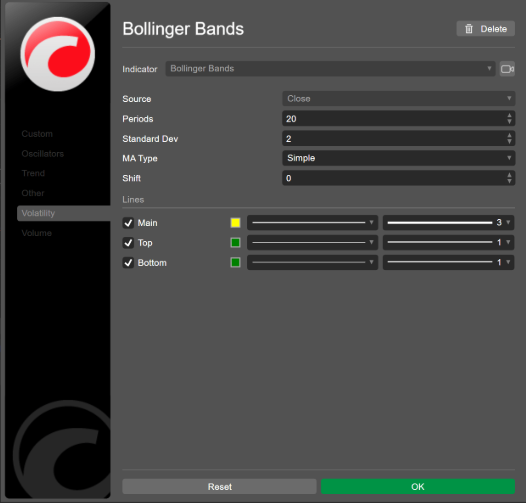
Moreover, customizing your indicators is just as easy. After you add an indicator, cTrader will display a new toolbar in the top-left corner. Hover over the toolbar to access indicator settings. From setting the Hide/Show feature to adjusting parameter values like changing colors and line thickness, cTrader matches your workspace to your trading style. Want to try a new look? No problem, the reset option will get you back to square one.
Managing Multiple Indicators
When multiple indicators are in play, you need to manage them efficiently.
In cTrader, you can hide or show indicators with a click, modify their properties, or remove them altogether. Hotkeys like Ctrl+I make this process seamless, so you can manage all indicators from one window.
Custom indicators are also supported. You can download or create your own using .algo files and tailor your toolkit to your trading needs. Once ready, you can add them to your chart just like built-in indicators, ensuring a consistent experience.
Drawing Tools and Chart Objects
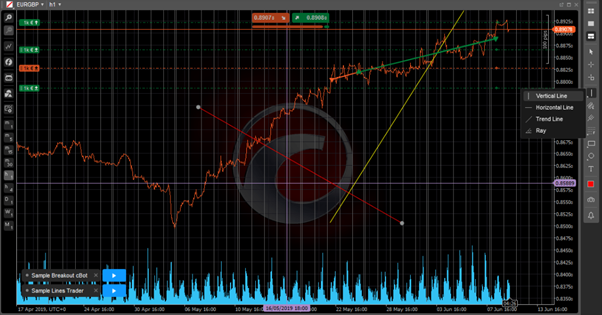
Visualization is key in technical analysis and cTrader shines in this area by allowing you to draw lines, shapes and markers directly on the chart. cTrader has a wide range of options including trendlines, rays and Fibonacci tools.
Trendlines, for example, are essential for marking trends or forecasting future price movements. Just select the Trendline tool from the single line button on the Instruments toolbar, click on the chart and drag to draw a line between two points. The ability to adjust angles and extend lines to infinity makes it more useful.
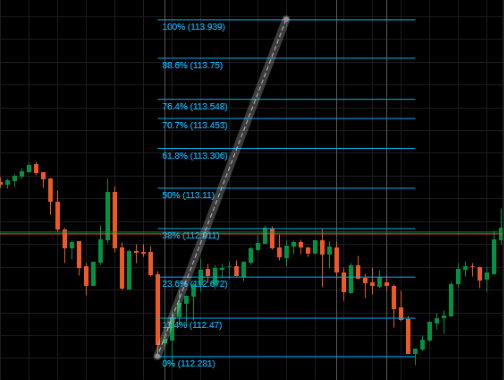
Fibonacci tools like Retracement, Fan, and Expansion help you identify potential support and resistance levels. Drawing them on the chart is a breeze – click, drag and cTrader will do the math for you. These are super useful for spotting retracement opportunities during uptrends or downtrends.
Want to add annotations or highlight specific areas? The Pencil tool allows freeform drawing so you can customize your charts.
Also, Shapes like rectangles and ellipses allow you to zoom in on specific areas of interest like consolidation zones or breakout regions. Markers, on the other hand, can be used as reminders or highlight critical price levels so you never miss a moment. cTrader offers 8 different types of markers on the charts for accurate analysis. You can place Circles, Up Arrows, Down Arrows, Squares, Diamonds, Stars, Up Triangles, and Down Triangles.
Advanced Tools: Channels, Pitchforks, Snapshots
For advanced analysis, cTrader has tools like Equidistant Channels and Andrew’s Pitchfork. Equidistant Channels are two parallel lines perfect for visualizing price ranges. You can adjust the distance between lines or move them as a unit to follow the market.
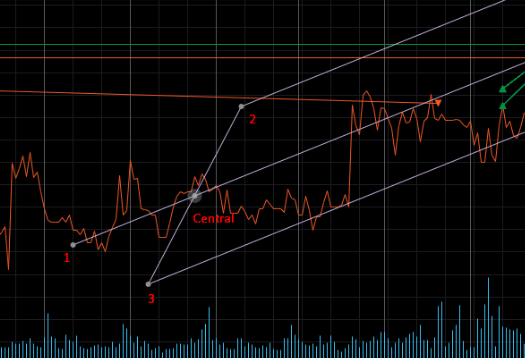
Andrew’s Pitchfork takes it to the next level by identifying support and resistance levels with three parallel lines. By aligning these lines with major price peaks and troughs, you can forecast future movements with great accuracy.
The Market Snapshot is another great feature. With a hover on the chart, you can see Open, High, Low, and Close prices and volume at a specific point. This gives you context instantly and saves you time during analysis.
Maximizing Efficiency with Customization
Efficiency in trading is all about customization.
cTrader is flexible and you can customize almost everything in your technical analysis setup. From default settings for tools to colors and styles, the platform will adapt to your needs.
For example, you can set horizontal lines to snap to exact price levels or default angles for trendlines. Fibonacci tools have adjustable levels and prices so they match your trading strategy. And if you work with multiple charts, cTrader’s layout options will allow you to save and switch between different setups easily.
Tips for Using cTrader’s Technical Analysis Tools Effectively
- Combine Tools for Better Insights: Use a mix of indicators and drawing tools to confirm trends and potential reversal points.
- Focus on Key Levels: Utilize horizontal lines and Fibonacci retracement to identify crucial support and resistance areas.
- Keep It Simple: Avoid overcrowding your chart with too many indicators; focus on the tools that align with your strategy.
The Advantages of Technical Analysis on cTrader
With its rich set of features and intuitive design, cTrader simplifies the process of applying technical analysis. Here is why it stands out:
- User-Friendly Interface: Every action on cTrader is intuitive and requires minimal effort.
- Customizability: From modifying indicator parameters to designing unique tools, cTrader empowers traders to create a workspace that matches their approach.
- Comprehensive Toolset: With everything from Fibonacci retracements to advanced drawing tools, cTrader offers a toolkit that caters to both novice and professional traders.
- Cross-Asset Compatibility: Apply the same technical analysis techniques across forex, cryptocurrencies, and other asset classes without switching platforms.
- Real-Time Feedback: The platform’s dynamic interface ensures that all changes and inputs are reflected immediately, keeping traders in sync with the market.
Conclusion
Technical analysis is an art and a science, and cTrader equips you with the tools to master it. From intuitive indicators to advanced charting features, the platform offers everything you need to analyze markets effectively. cTrader’s toolkit is always there to help in identifying trends, spotting reversals, or refining entry points,
Get into technical analysis today and take control of your trading with cTrader’s powerful tools.
