If you have ever felt like your forex trades are based on incomplete information, multi-timeframe analysis (MTA) might be the missing link. By combining different timeframes—daily, hourly, 5 minute, or more, you can get a better view of the market, refine your entries and exits and build a more solid strategy.
In this post, we will look at what MTA is, why it works, and how you can add it to your trading regime to build a winning forex strategy.
What is Multi-Timeframe Analysis?
Multi-timeframe analysis is exactly what it sounds like – analyzing the market through multiple timeframes to get a full view before making trading decisions. It is about stepping back to see the bigger picture and zooming in on details.
For example, you might have a preferred timeframe – say the 1 hour chart – but looking at the daily or weekly charts can show you long term trends or major support and resistance levels. This can help you align your strategy with the broader market environment.
Instead of relying on one chart, multi-timeframe analysis allows traders to:
- Optimize entry and exit points.
- Enhance risk management.
- Avoid false signals.
- Improve overall trade setups.
At first, this may feel overwhelming. But as you will see, it is not as complicated as it sounds and the benefits far outweigh the initial learning curve.
Why Use Multi-Timeframe Analysis?
The main benefit of MTA is that it stops tunnel vision. By looking at multiple charts, you can see conflicting signals and refine your decision making.
Example of MTA in Action
Suppose you are trading the GBP/USD pair. On the 4-hour chart, you spot what looks like a bearish breakout. It is tempting to jump in a SELL trade right away. But when you switch to the daily chart, you see the price is approaching a strong support level – a buy reversal zone.
So, instead of getting in early, you wait. Sure enough, the price fails to break through the support and reverses sharply. If you had not looked at the daily chart, you would have entered a losing trade.
This is MTA in a nutshell: aligning your trade with the bigger picture to avoid mistakes.
How to do Multi-Timeframe Analysis
To effectively use MTA, you need a structured approach. One of the most popular methods is the top-down approach where you start with the highest timeframe and work your way down to the lowest. This way your trades match with the market’s overall trend and structure.
Step 1: Start with the Bigger Picture
Begin with the highest timeframe you have, either 4-Hour, daily, or weekly chart. These frames show long term trends and key support/resistance levels.
For example, if the weekly chart shows a strong bull trend with price approaching a key support level, this means long term buyers may step in. Knowing this, you can focus on buy opportunities.
Why Higher Timeframes Matter: Trends on higher timeframes are more reliable because they are the collective actions of many traders over a longer period. A weekly uptrend is unlikely to reverse due to short term volatility.
Step 2: Move to Intermediate Timeframes
Once you have identified the bigger trend, move to an intermediate timeframe, which can 4 hour, 1 hour, or 30 minute chart. Here you can see how price is behaving compared to the bigger picture. Look for patterns, retracements or consolidations that fit your bias.
For example, if the daily chart is bullish, check the 4 hour chart for pullbacks to support levels or bullish continuation patterns. These give you clues for entry points.
Intermediate Timeframes’ Role: These timeframes bridge the gap between the bigger picture and the finer details, so you can see actionable setups while staying in line with the trend.
Step 3: Zoom in for Precision
Finally zoom in to smaller timeframes, 15 minute or 5 minute charts. Use these to pinpoint your entry and exit points. For example, you might want to wait for a candlestick pattern like a bullish engulfing candle or use indicators like stochastic oscillators to confirm entry signals.
Why Smaller Timeframes are Important: Smaller timeframes shine when making tactical decisions like setting stop-loss or determining entry zones. They ensure you can react to price action while staying in line with the trend.
A Detailed Example of Multi-Timeframe Analysis on XAUUSD
Let’s walk through an example of MTA considering the XAUUSD chart.
Daily Chart: The Big Picture
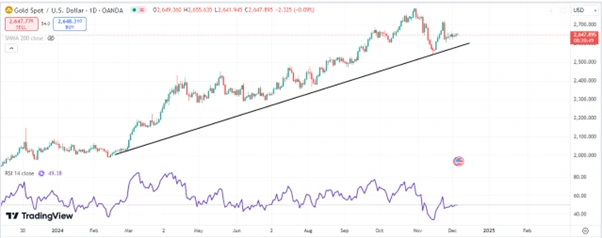
Let’s start with the following daily chart.
If you zoom out, you will notice that XAUUSD is clearly in a long-term uptrend. Gold has been climbing steadily, showing strong bullish momentum. Recently though, it pulled back to a key support level—a level that was held strong multiple times before.
This support has proven itself as a reliable area where buyers step in. That makes it a zone worth paying attention to.
And here is a golden rule: Stick with the trend! In this case, that means focusing on buy opportunities only.

4-Hour Chart: Signs of a Reversal
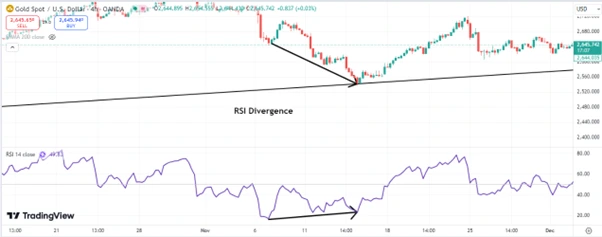
Now let’s zoom in a bit to the 4-hour chart. You can see that at that same key support level from the daily chart, we have an RSI divergence forming.
What is an RSI Divergence? It is like the market saying that the trend might be losing steam and could flip soon. RSI divergence happens when the price of something is moving one way, but the RSI (Relative Strength Index) is moving the opposite way.
In this scenario, this aligns perfectly with the daily uptrend we just talked about. Everything is starting to line up like puzzle pieces, hinting that the market could soon move higher again.

1-Hour Chart: Time to Get Precise
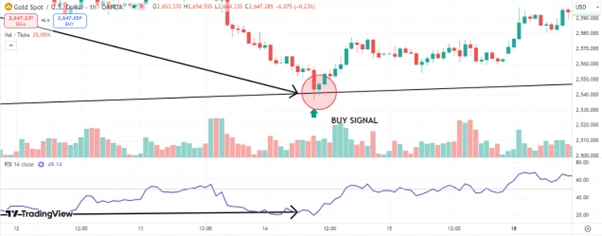
For those of you who like to fine-tune your entries, let’s jump to the 1-hour chart. This is where you can really dial in.
What do we see here? The price is showing a hammer candlestick pattern, signaling a potential bullish reversal as buyers regained control after strong selling pressure, and it is doing so with increasing volume. That is a strong signal! When volume picks up, it can work as a stamp of approval from the market, confirming that the move is legit.
This move tells us the retracement is likely over, and the uptrend might be ready to resume. Now you have got your green light for a buy setup.

Putting It All Together
Here is the thing about using multiple timeframes – You get the bigger picture from the daily chart, confirmation from the 4-hour chart, and a precise entry signal from the 1-hour chart.
By combining these three perspectives, you will be able to make an informed trade that flows with the market’s overall direction.
Trading does not have to be complicated. Stick to the trend, look for confirmation, and enter when the stars align. In this case, it all points to buying Gold at the right time.
Common Mistakes to Avoid in Multi-Timeframe Analysis
- Too Many Timeframes
While it is tempting to analyze every chart available, considering too many timeframes will paralyze your analysis. It is better to stick to 2 or 3 timeframes for a clear and actionable view.
- Ignoring the Bigger Picture
Lower timeframes are noisy and can generate false signals. Always start with higher timeframes to make sure your trades are in line with the overall market.
- Overcomplicating It
MTA does not have to be complicated. Focus on key levels, trends and patterns instead of adding unnecessary indicators.
- Switching Timeframes Without a Plan
A systematic approach is key. Jumping between timeframes without a plan will give you contradictory signals and bad decisions. Make sure that multiple timeframes are evenly balanced.
Looking at Some Advanced MTA Applications
For experienced traders, MTA offers much more. Beyond trends, it can be used to gauge market sentiment, volatility and even fundamental analysis.
For example, a trader analyzing USD/JPY during a central bank announcement might use higher timeframes to see the long term impact of monetary policy while short term charts to see the immediate market reaction. This multi-dimensional approach helps traders to stay adaptable and informed even in wild conditions.
Another advanced application is to correlate MTA with technical indicators. Combining moving averages on the weekly chart, Fibonacci retracements on the daily chart and RSI divergences on the hourly chart is a layered approach that covers multiple market behaviors.
Building Confidence with MTA
The more you practice MTA, the more confident you will be in your trading decisions. Over time you will develop an instinctive feel for how timeframes interact and how to use them to your advantage.
For beginners, start with a demo account to practice MTA without risking real money. Focus on trends, support and resistance levels, and entry and exit points on different charts. As you get more experience you will find it easier to incorporate Multi-timeframe analysis into your live trading.


